Product Summary
i2 Analyst’s Notebook is a powerful investigative analysis platform that turns complex, multi-source data into actionable intelligence. Designed for modern analysts and investigators, it brings together visual link analysis, timeline reconstruction, network insights, and advanced filtering tools to help you identify key entities, uncover hidden connections, and accelerate investigative outcomes.
- i2 Analyst’s Notebook enables analysts to transform complex, multi-source data into clear, actionable intelligence through advanced visual analysis
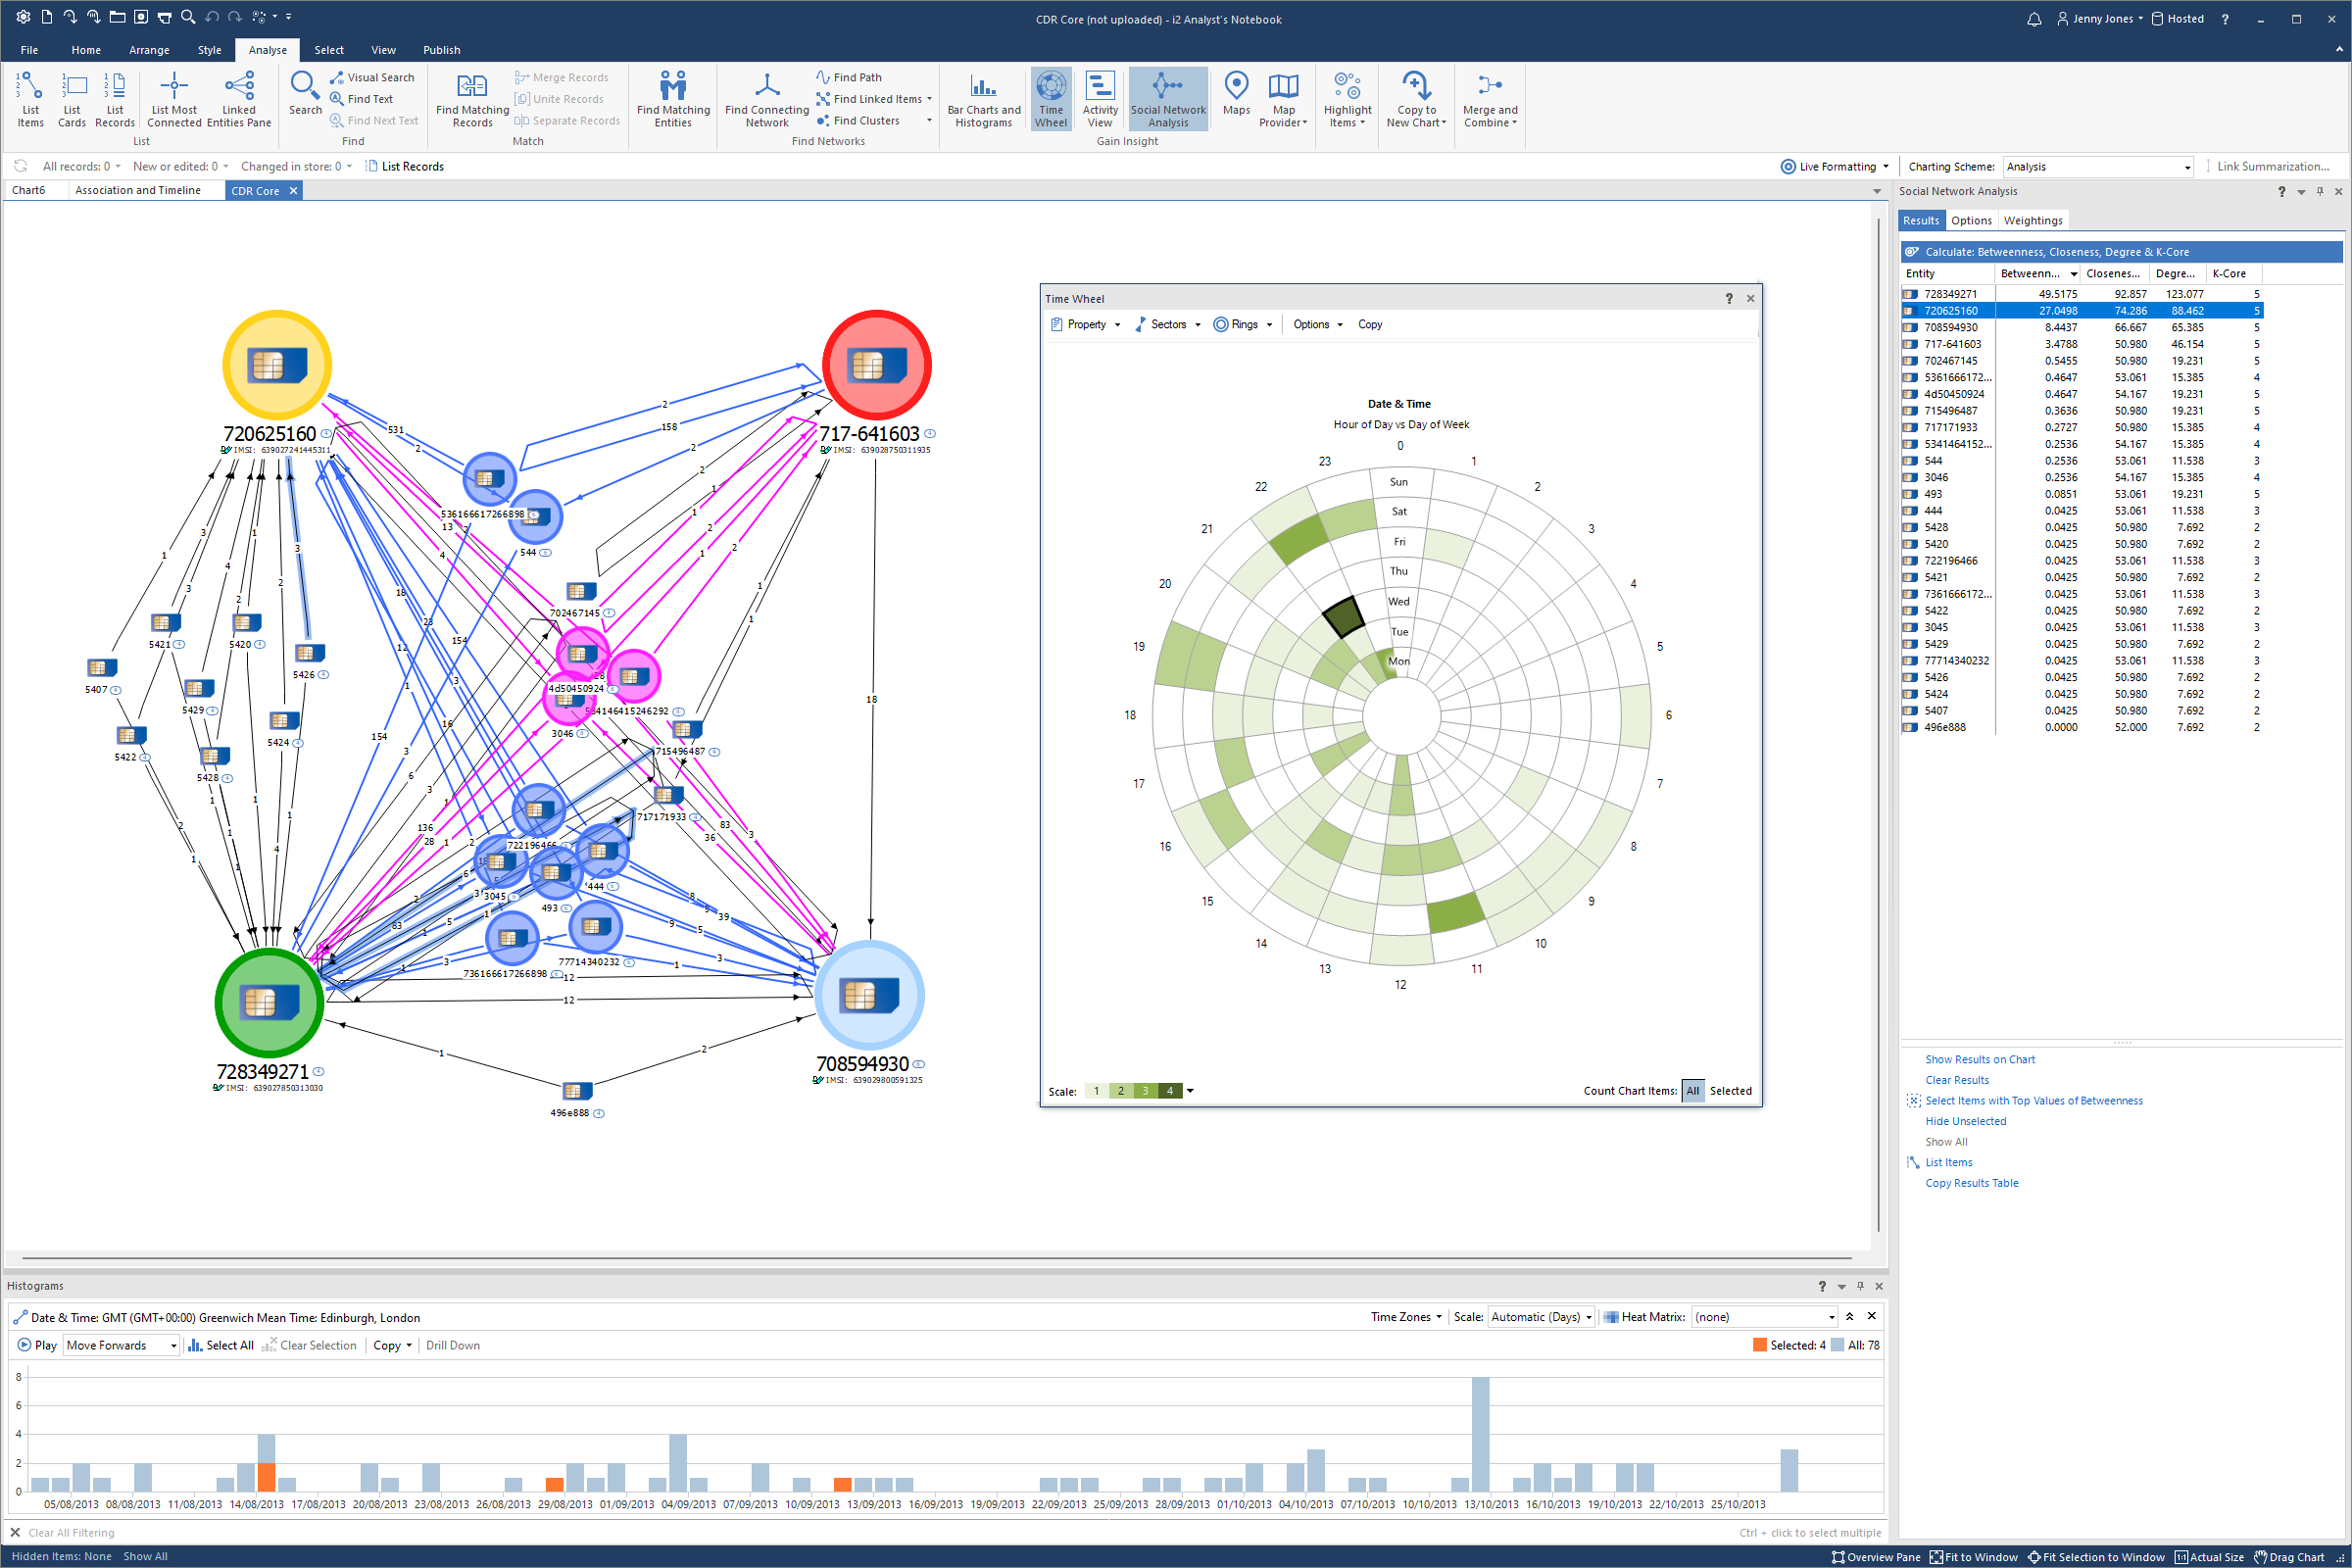
- It visualizes entities, relationships, timelines, and networks to reveal hidden connections, patterns, and trends across investigations
- By applying link analysis, temporal analysis, and social network analysis, it helps identify key individuals, structures, and behaviors more efficiently
- The platform integrates data from diverse structured and unstructured sources, allowing analysts to correlate information within a single analytical view
- Designed for investigative and intelligence workflows, i2 Analyst’s Notebook accelerates insight generation and supports confident, evidence-based decision-making
Description
-
Flexible Data Acquisition
Quickly import a wide variety of structured and unstructured data sources using intuitive drag-and-drop input, visual import tools, and extensible connectors, enabling faster preparation and unified analysis workflows.
-
Model Data to Support Investigation
Represent and organize information as entities, links, events, timelines, and attributes in a single environment. Transform raw data into meaningful structured views that support deeper investigation and visual exploration.
-
Multi-Dimensional Analysis
Perform link analysis, temporal analysis, spatial views, statistical exploration, and social network analysis (SNA) to identify key individuals, relationship structures, and patterns of activity across complex datasets.
-
Transform Complex Data into Actionable Intelligence
Convert complex, disparate information into clear visual intelligence outputs. Create easy-to-follow briefing charts, detailed visualizations, and cohesive intelligence products that improve operational decision-making.
-
Communicate and Share Intelligence
Produce visual briefing charts and reporting outputs, including redacted versions by security clearance level. Share intelligence with stakeholders, and allow chart access by non-Analyst’s Notebook users via free chart reader tools.